INFRASTRUCTURE INTELLIGENCE | ZAMBIA
Research by Daka & Associates Construction Brokerage Limited
Evidence snapshot: 4 November 2026. Supporting research report issued: 6 November 2026.
The opportunity begins with a signal. Commercial commitment should follow verified evidence.
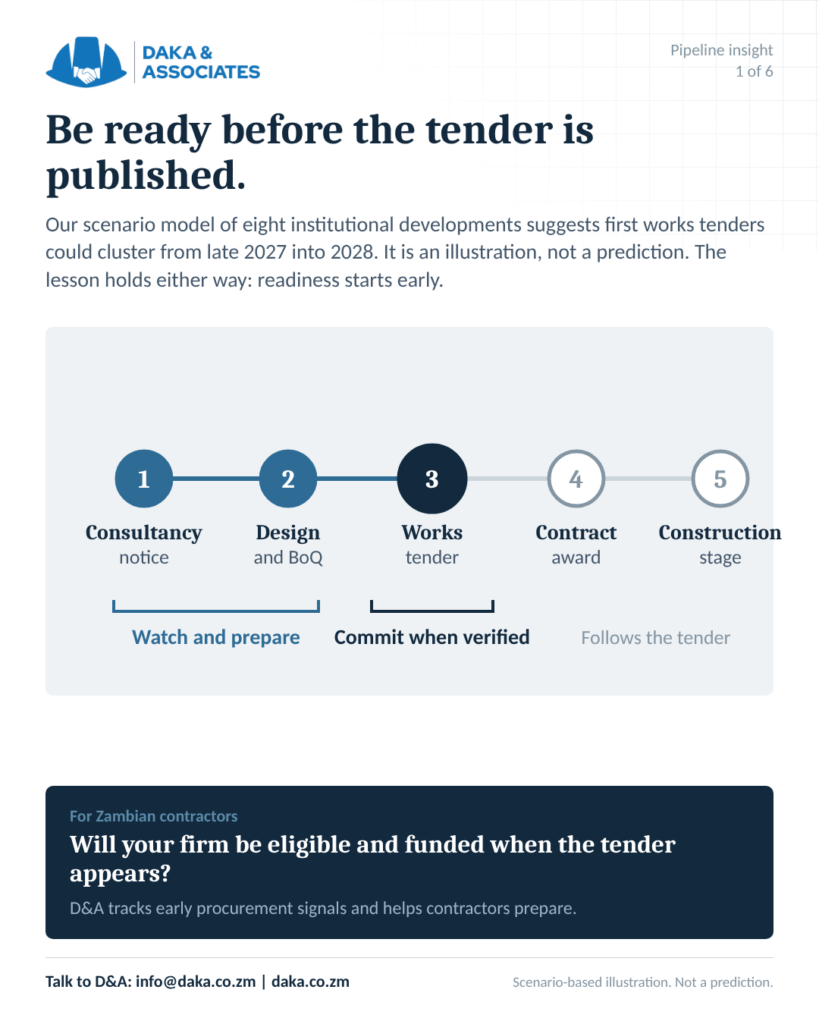
Zambia infrastructure forecasts are useful when they help a contractor decide what to verify next. By the time a works tender appears, firms may already be under pressure to assemble partners, demonstrate capacity and price an unfamiliar scope. Earlier consultancy and feasibility notices can create preparation time, provided project intent is distinguished from funded construction and confirmed procurement.
Daka & Associates’ infrastructure forecasting framework turns early procurement signals into a structured watchlist. This application examines eight Zambian developments and shows how contractors, developers, investors and infrastructure partners can prepare in stages: identify the asset, verify progress, test funding and procurement assumptions, then commit resources when the evidence supports a pursuit.
Read the forecast correctly
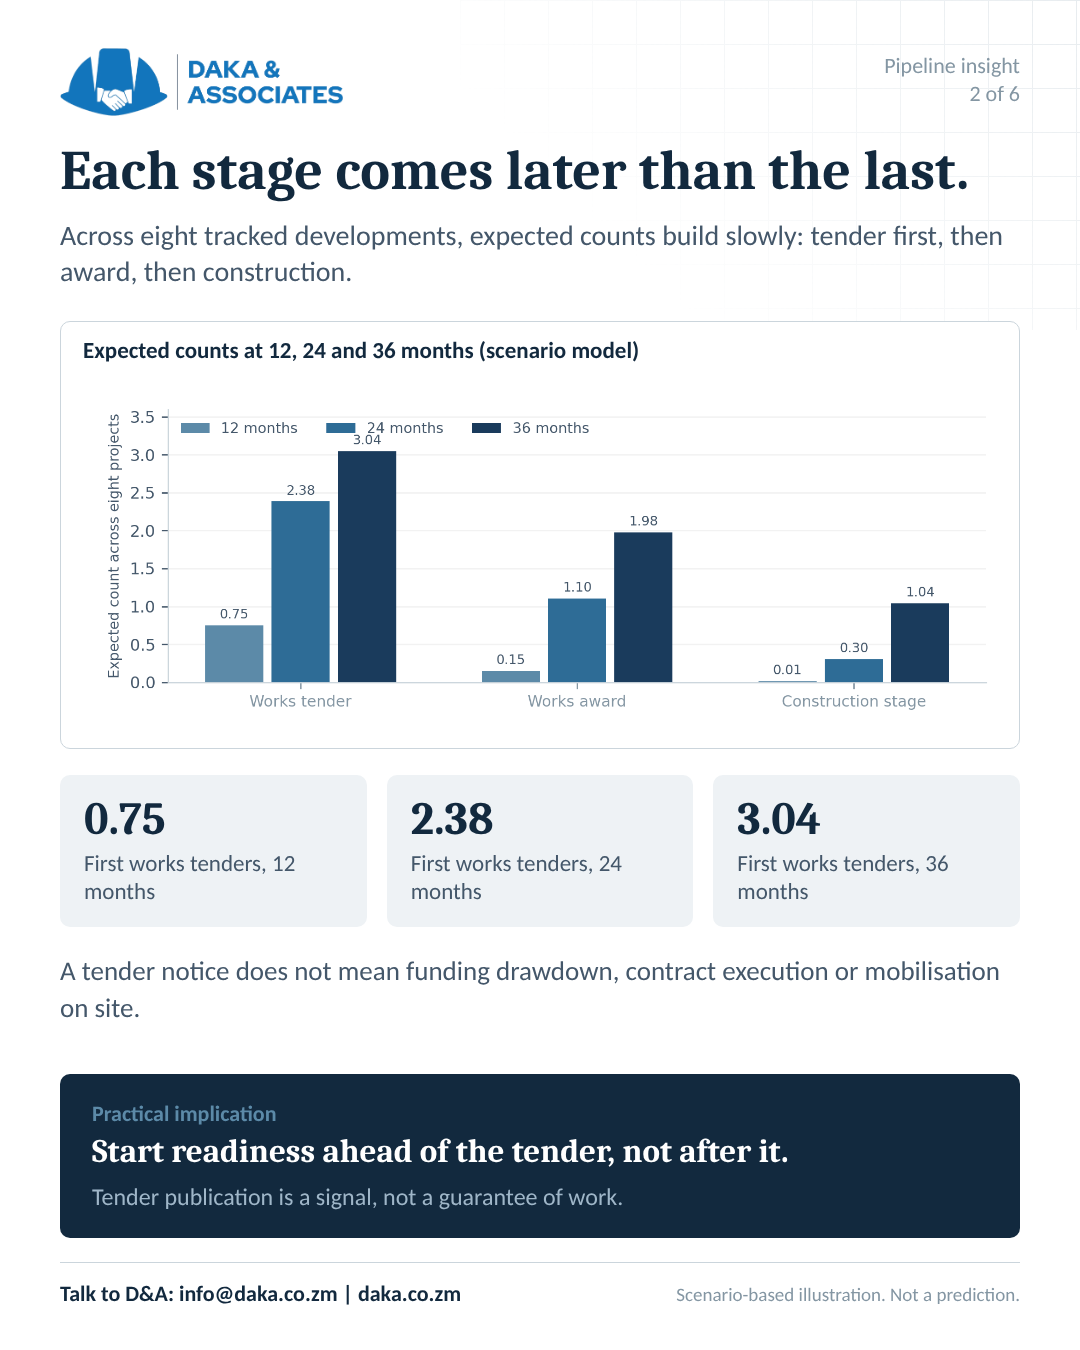
The baseline scenario produces 2.38 expected first works tenders by November 2028 and 3.04 by November 2029 across eight tracked projects. These are sums of illustrative simulation outputs, not confirmed tender counts.
All percentages below are uncalibrated illustrative simulation outputs, not verified project probabilities. The report does not establish that any of these works tenders has been issued or that construction funding is confirmed. Its evidence snapshot is 4 November 2026; it is not a live procurement-status update.
Why procurement signals matter before the tender
A design procurement can reveal an institution’s intention to investigate or prepare an asset. A feasibility award can indicate that an investment concept is being tested. Neither proves that design has commenced, a construction budget has been approved or a works contract will follow.
The commercial value lies in using each signal to ask the next verifiable question. Has a consultant been appointed? Have drawings and the bill of quantities been accepted? Is there an approved capital allocation or credible financing arrangement? What package could an eligible contractor actually pursue?
For contractors, that creates a disciplined watchlist. For developers and investors, it exposes the decisions still needed to make a project procurement-ready. For infrastructure partners, it identifies where specialist capability or a carefully structured joint venture may eventually be relevant.
Eight Zambian infrastructure projects to monitor
The underlying export contains 115 e-GP source notices. Within the eight-project forecast set, the report classifies seven signals as design procurement and one as a feasibility award. It records three independently supported consultancy notice-to-award intervals, but zero independently matched consultancy-to-works pairs. Those consultancy intervals cannot establish the lag to a construction tender.
The portfolio therefore represents a research and readiness pipeline. It is not a schedule of approved construction contracts, a complete inventory of Zambia’s infrastructure market or a measure of contract value.
| Tracked development | 12 months | 24 months | 36 months | Model peak quarter |
|---|---|---|---|---|
| BoZ near-site data centre | 11.5% | 34.3% | 41.7% | Q4 2027 |
| NAPSA Kingstone Building | 9.8% | 34.1% | 43.4% | Q2 2028 |
| BoZ auditorium refurbishment | 9.5% | 33.2% | 41.9% | Q4 2027 |
| WCFCB four-branch programme | 10.7% | 33.1% | 40.8% | Q2 2028 |
| NAPSA mixed-use development | 9.9% | 32.6% | 41.4% | Q1 2028 |
| ZIALE Andrew Mwenya Campus | 10.6% | 32.2% | 41.4% | Q1 2028 |
| BoZ third-floor annex | 9.8% | 31.1% | 39.7% | Q4 2027 |
| ZIALE Mutandwa development | 3.1% | 7.6% | 14.0% | Q2 2029 |
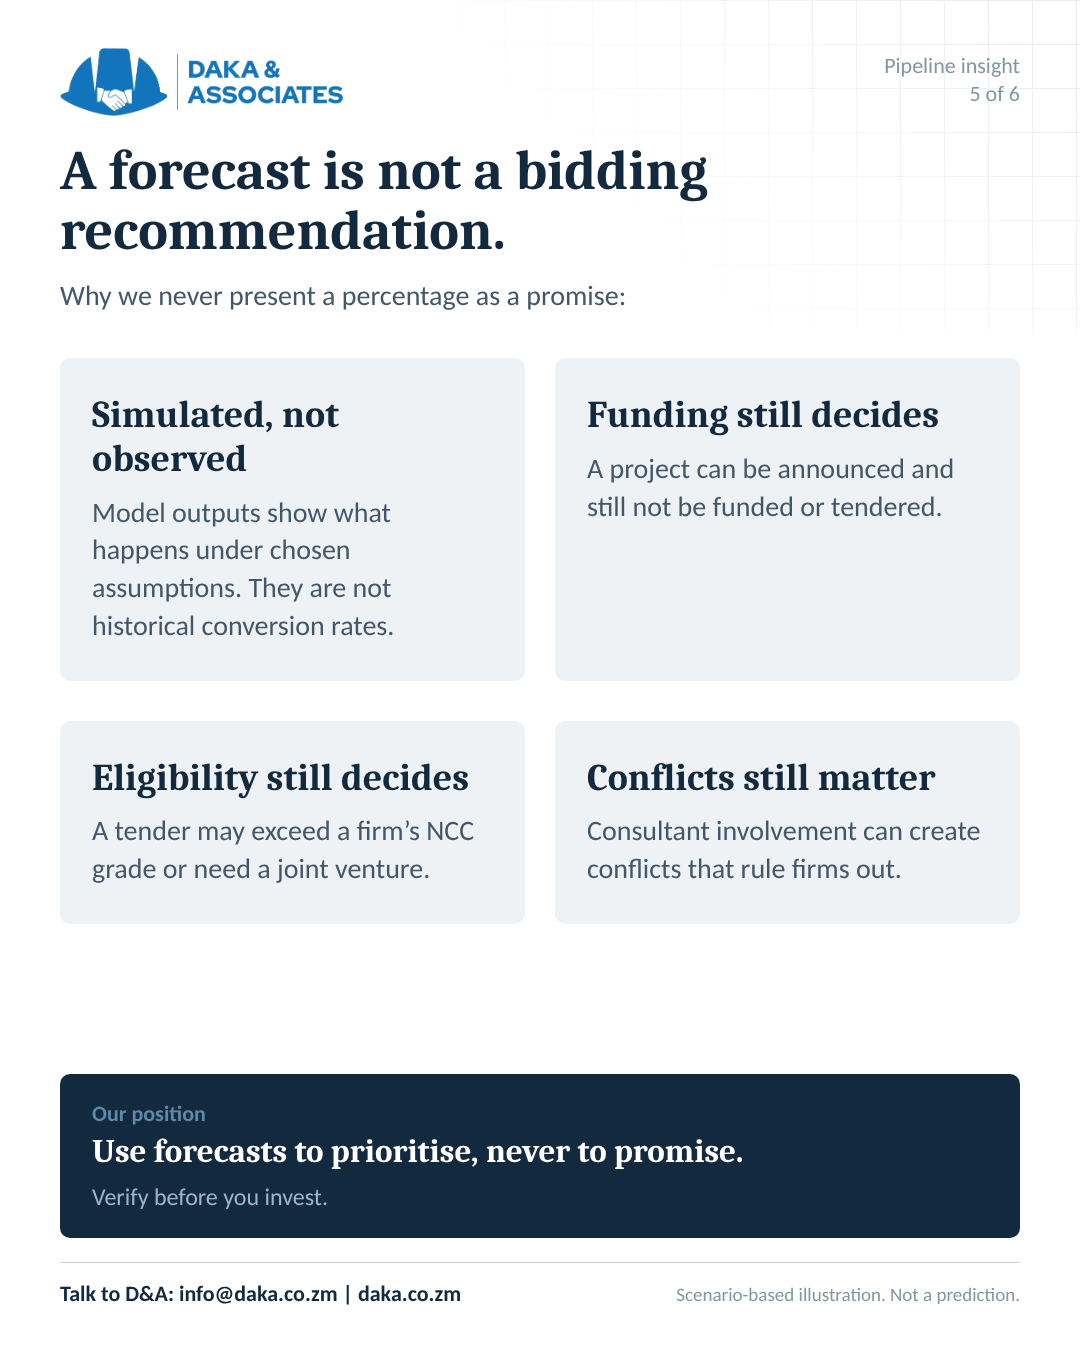
A peak quarter is the quarter with the largest simulated first-tender share for that project. It is not a procurement commitment. Individual peak-quarter outputs range from 2.2% to 7.2%; cumulative horizon figures must not be confused with quarterly figures.
Project forecasts and verification priorities
1. Bank of Zambia near-site data centre: establish the physical scope
At 34.3% by 24 months, this has the highest illustrative two-year output, with a Q4 2027 model peak. The first task is to distinguish civil and building works from specialist mechanical, electrical and plumbing (MEP) systems and ICT fit-out. Contractor and technology partnerships should follow the verified package, rather than assumptions about what a “data centre” procurement includes.
2. NAPSA Kingstone Building, Ndola: verify the investment decision
The redevelopment reaches 34.1% at 24 months and 43.4% at 36 months, with a Q2 2028 peak. Verification should centre on investment approval and design progress. Redevelopment expertise and potential financing partners may be relevant, subject to the actual delivery structure and procurement terms.
3. Bank of Zambia auditorium: confirm that a works opportunity remains ahead
The refurbishment has a 33.2% two-year output and a Q4 2027 peak. Confirm whether a future works package remains to be procured, its route and its fit-out scope. A consultancy signal alone does not justify substantial bid expenditure.
4. WCFCB four branches: understand the sites and lots
The Workers’ Compensation Fund Control Board programme covers Mazabuka, Chipata, Kabwe and Luanshya. Its illustrative two-year output is 33.1%, peaking in Q2 2028. Confirm consultant appointment, four-site funding and whether procurement would be combined or divided into lots. Regional contractor capacity and potential JV arrangements can then be assessed against a defined scope.
5. NAPSA mixed-use development, Petauke: connect site readiness to delivery
The baseline output is 32.6% at 24 months, with a Q1 2028 peak. The next checks are site status and the investment decision. Regional delivery options and likely National Council for Construction (NCC) requirements deserve early investigation, while actual eligibility must await verified procurement terms.
6. ZIALE Andrew Mwenya Campus: follow the drawings and BoQ
The architectural drawings and bill of quantities signal produces 32.2% at two years, peaking in Q1 2028. A dated, accepted BoQ, a construction budget and a documented intended procurement date would materially improve the evidence base. Only then should a building-contractor shortlist move beyond preliminary screening.
7. Bank of Zambia third-floor annex: resolve procurement status first
The head-office fit-out or refurbishment signal has a 31.1% two-year output and a Q4 2027 peak. Establish whether works procurement has already occurred or whether the recorded activity concerns only options or design consultancy. Keep readiness activity light until that distinction is resolved.
8. ZIALE Mutandwa: monitor the development case over a longer horizon
The hotel and office-park feasibility case differs from the design-procurement group: 7.6% by 24 months and 14.0% by 36 months, with a Q2 2029 peak. The report records a consultancy award; commencement and downstream works are unverified. Track the feasibility outcome, potential PPP structure, bankability and financing decisions before considering contractor mobilisation.
Construction procurement timing: three scenarios
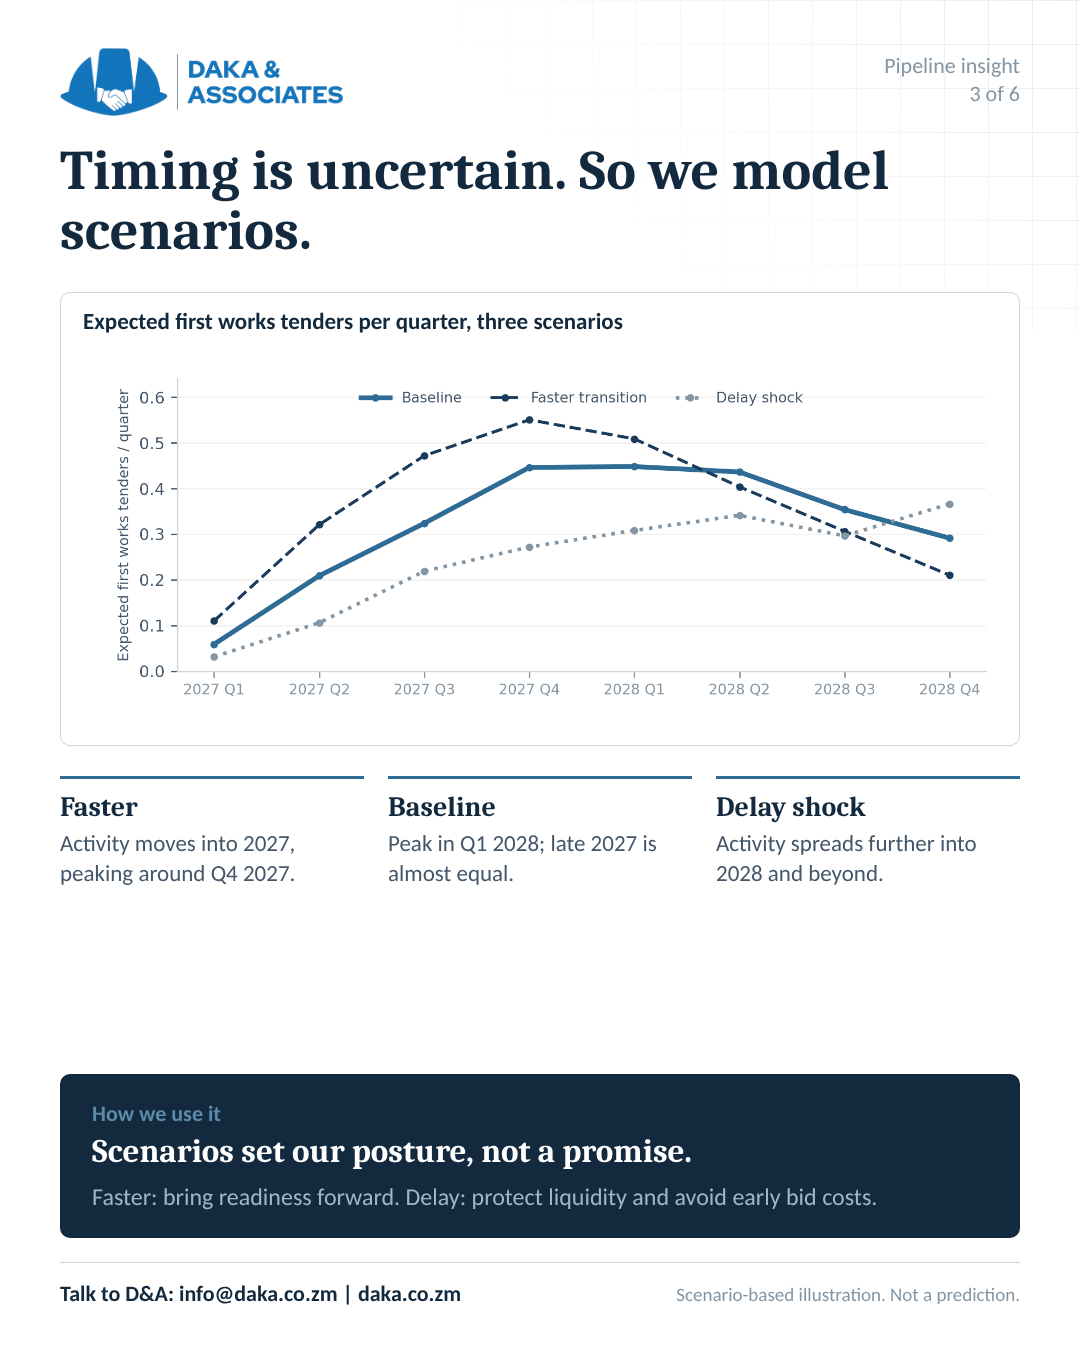
The baseline concentrates simulated first-tender activity in late 2027 and early 2028. Q1 2028 is the narrow portfolio peak at 0.448 expected first notices, almost equal to Q4 2027 at 0.446. That tiny difference does not support treating one quarter as a reliable bidding deadline.
At 24 months, the report’s delay-shock scenario produces 1.69 expected first tenders, compared with 2.38 in the baseline and 2.77 under faster transitions. The faster scenario shifts the peak towards Q4 2027; the delay scenario spreads activity further into 2028 and beyond. These are assumption changes, not statistical confidence bounds.
The distinction between milestones is equally important. At 24 months, baseline expected counts are 2.38 first tenders, 1.10 works awards and 0.30 construction-stage entries. At 36 months they are 3.04, 1.98 and 1.04 respectively. A tender notice does not establish contract execution, funding drawdown or on-site mobilisation.
How the infrastructure forecasting framework works
The infrastructure forecasting framework simulates a project’s movement through lifecycle stages, including progress, dormancy, cancellation and other exits. Its semi-Markov structure allows transition chances to depend on time spent in a stage. It uses 1,600 simulated paths per project and scenario to estimate whether a first works tender occurs before each horizon.
The portfolio count is the sum of those project outputs. The unrounded two-year baseline sum is 2.383125, presented as 2.38; the report gives approximately 3.043 at three years, presented as 3.04. These correspond to approximately 3 November 2028 and 4 November 2029. A fractional expectation is an average under the model, not a forecast that exactly two or three tenders will appear.
The transition assumptions have not been fitted to representative Zambian project histories. Seven projects share an assumed design-procurement state and a common transition structure, so small ranking differences do not demonstrate differences in institutional liquidity, design readiness, project size or approvals.
Monte Carlo sampling error can be measured, but it is only one component of uncertainty. The report establishes neither a validated portfolio variance nor a credible prediction interval. A 34.3% output means that 34.3% of simulated paths reached the milestone under selected assumptions. It does not establish a 34.3% real-world probability for the project.
Calibration requires matched consultancy and works records, verified stage-entry dates, comprehensive observation periods, dormant and cancelled cases, and reliable outcome coverage. Predictions must be frozen and assessed after their horizons mature. Failure to find a notice is not, by itself, proof of project failure.
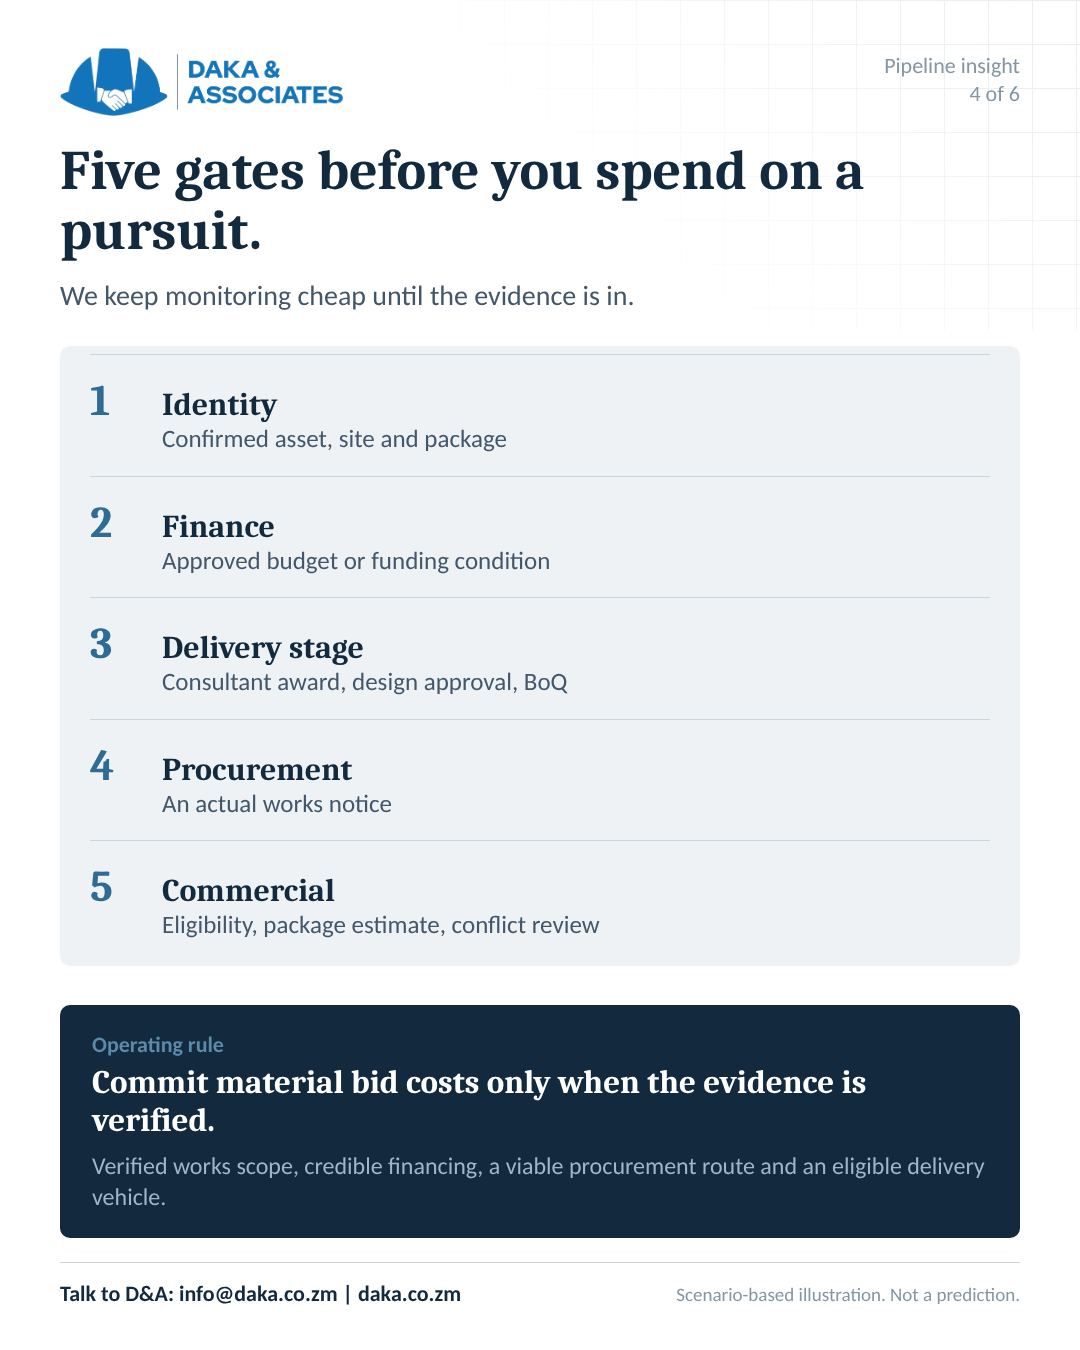
Contractor readiness in Zambia: five evidence gates
Use the forecast to decide what to investigate next. Increase pursuit spending only when evidence improves.
- Confirm identity. Match the physical asset, site and intended package. Merge records only when they concern the same project and scope.
- Test the funding basis. Seek an approved capital budget, financing agreement or documented funding condition. Record what is approved, what remains conditional and which source supports the conclusion.
- Verify delivery progress. Obtain dated evidence of consultant award or commencement, accepted designs, BoQ completion and relevant permissions. Replace assumed stages with observed dates where available.
- Watch for the actual works notice. Confirm its unique resource identifier, publication date, scope, method and lots. Update the forecast record and reassess whether the opportunity remains ahead.
- Pass the commercial gate. Check NCC grade and category, actual tender restrictions, conflicts involving consultants, partner capacity, bonds and working-capital requirements before authorising material pursuit expenditure.
Contractors can prepare capability records and assess partner gaps while monitoring costs. Developers can concentrate on approvals, scope definition and procurement readiness. Investors can test the investment structure and evidence of bankability. Specialist and regional partners can establish where their capability fits a potential package without assuming an appointment or award.
A monthly evidence review provides a practical operating rhythm. The report prioritises verification around WCFCB, NAPSA, ZIALE Andrew Mwenya and the BoZ data centre. For the auditorium and annex, resolve whether works procurement has already occurred; for Mutandwa, maintain a longer-horizon development watch.
Turn a procurement signal into a better-informed decision
The useful advantage is preparation grounded in evidence: a clearer scope, a credible funding basis, an eligible delivery team and a defined decision on whether to pursue.
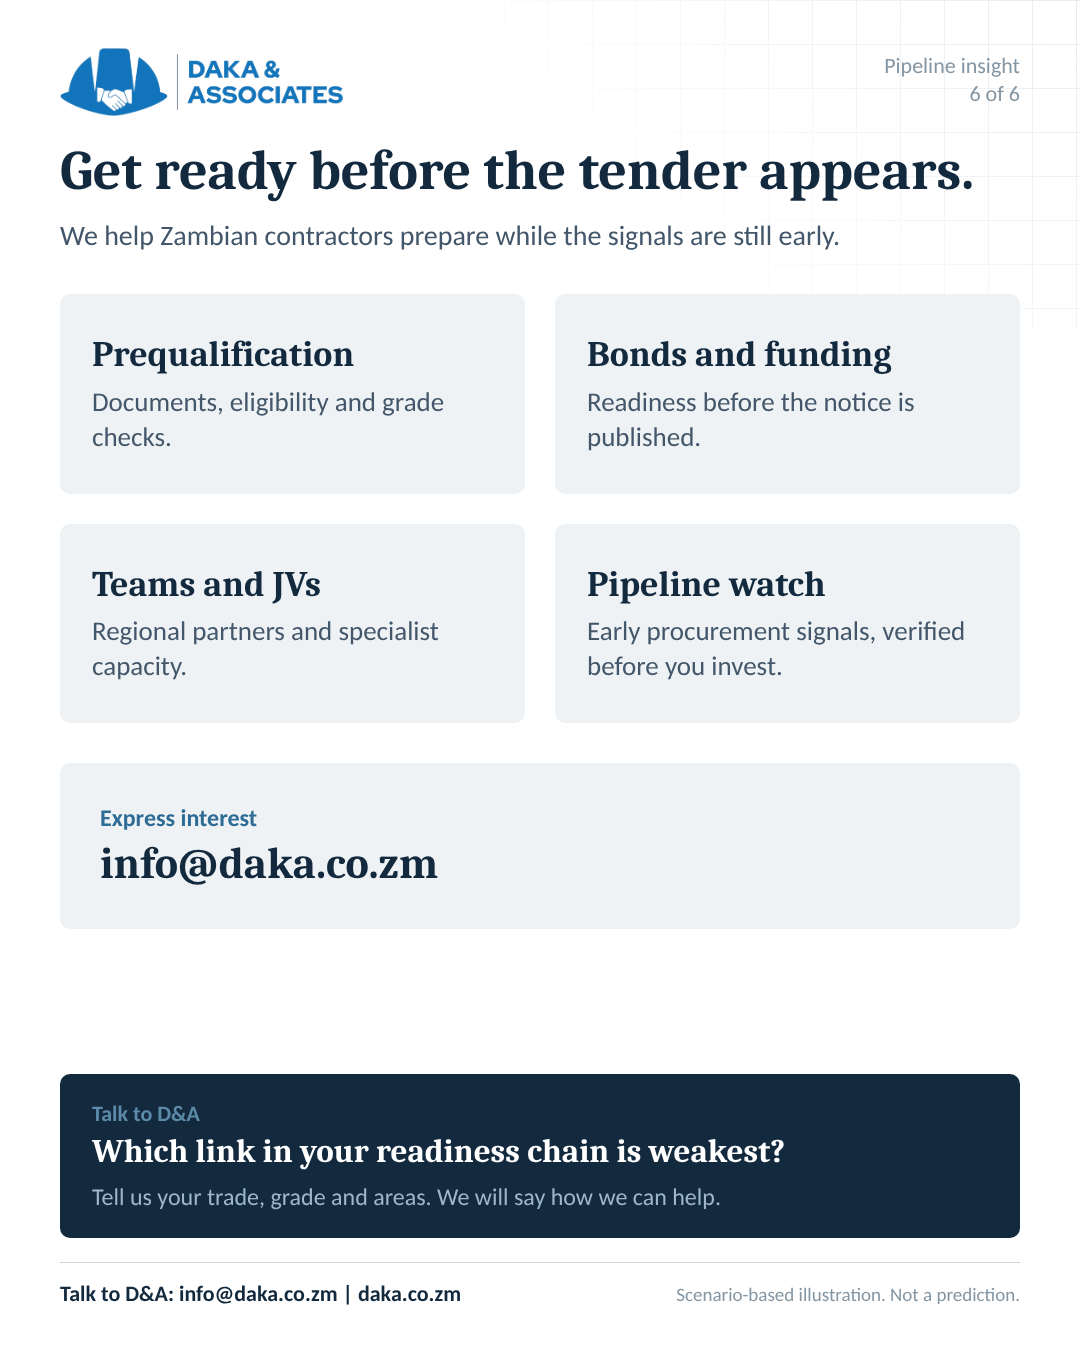
Contact Daka & Associates to discuss a focused project-verification and readiness brief. Bring the notice reference, target asset or location, your delivery capability and the decision you need to make. We can discuss the evidence gaps, potential partner requirements and next steps appropriate to your position in the pipeline.
Contact Daka & Associates about contractor readiness and procurement intelligence, or email info@daka.co.zm. Share your trade, NCC grade, operating areas and the opportunity you want to assess.
Questions about infrastructure forecasts and construction tenders in Zambia
Are these confirmed construction tenders?
No. These are early project signals assessed through an illustrative forecasting framework. Verify current opportunities, documents, amendments and deadlines on the Zambia Public Procurement Authority’s official e-GP portal and with the relevant procuring entity. The portal reference does not confirm a works tender for any project discussed here.
Does 2.38 expected tenders guarantee two or three contracts?
No. It is the sum of eight simulated first-tender probabilities under baseline assumptions. It does not establish a future tender count, works award or construction start, and the framework has not established a validated prediction interval.
What should contractors prepare before a works tender?
Prepare capability records, relevant experience, financial information and potential partner arrangements. Check registration, NCC grade and category, bond requirements and delivery capacity against the actual tender terms when available. Preparation should remain proportionate to verified project progress.
How often should the project watchlist be updated?
Review the evidence monthly and whenever a material event occurs, such as a consultant appointment, accepted BoQ, funding decision, cancellation or actual works notice. Record the source and date of each change. Do not treat this November 2026 snapshot as a continuously updated tender feed.
Related contractor and development guidance
- Early contractor involvement and pre-construction planning
- Development preparation before breaking ground in Zambia
- Sourcing, vetting and managing construction contractors
Source and reliance note
This article draws on Project Development and Construction Procurement Forecasts, the supporting research report for Daka & Associates’ infrastructure forecasting framework, V1, issued 6 November 2026, with a forecast origin and evidence-ingestion date of 4 November 2026. Its source base includes the supplied 115-entry e-GP export and the framework’s project, milestone and quarterly scenario outputs. Earlier notice publication dates do not imply earlier Daka & Associates knowledge.
The report traces WCFCB, Kingstone, Petauke and Andrew Mwenya to e-GP resource IDs 23984398, 26572891, 26534142 and 24615610; the BoZ data centre, auditorium, annex and Mutandwa to 27817658, 24215573, 24219477 and 19995494 respectively. These identifiers support source tracing; they do not establish current works procurement or funding status.
All scenario percentages remain uncalibrated illustrative outputs. This is a research and readiness framework, not a tender announcement, funding confirmation, assurance of award or basis for an investment commitment without independent due diligence.